Data Visualization
Using Pandas, Matplotlib, Plotly, and Seaborn I have built testing protocols, to collect and plot data for multiple projects.
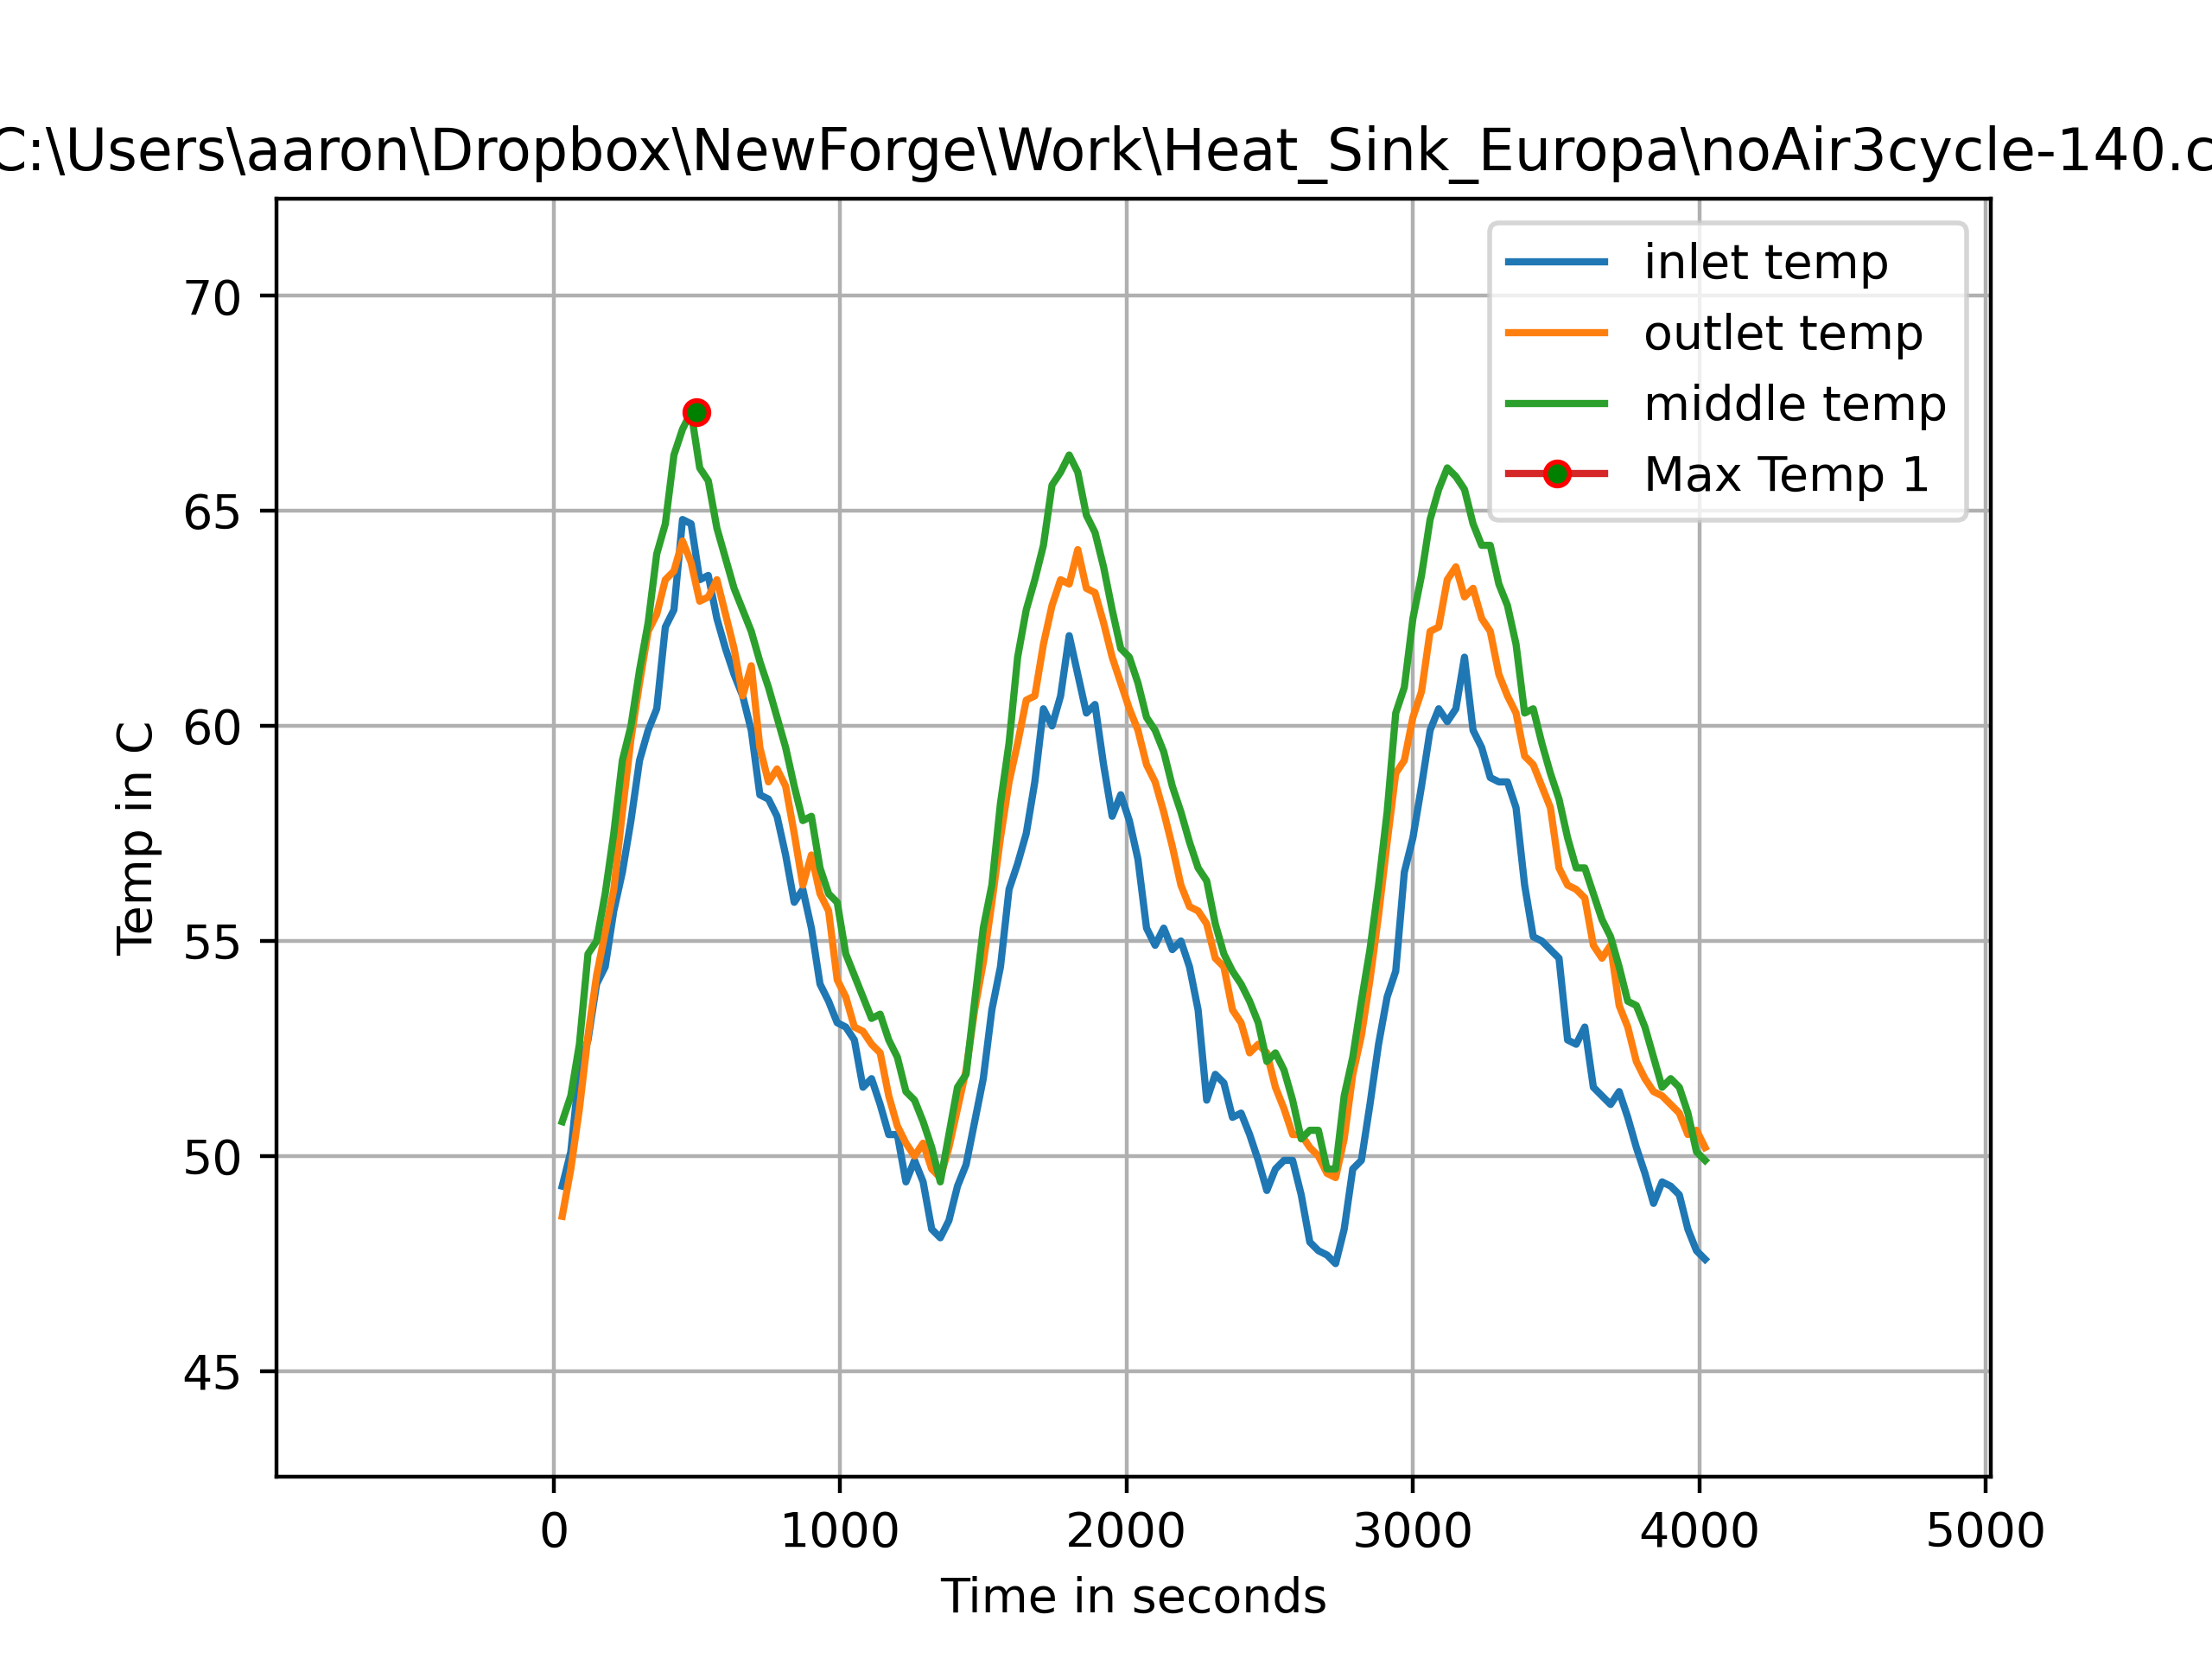
Heat Sink Max Energy Dissipation Testing

Long LED Array Heat Sink Testing
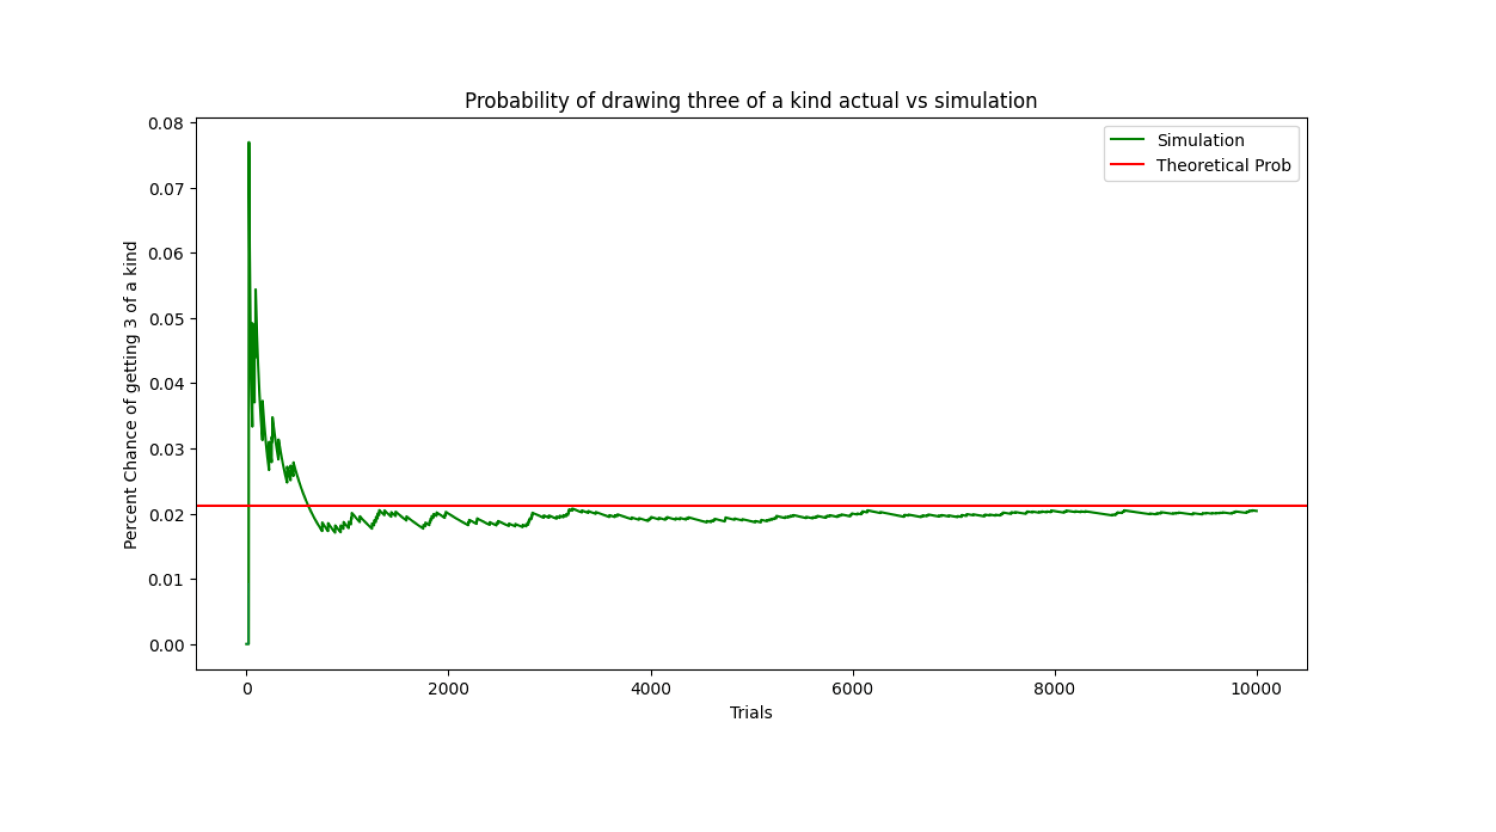
Simulations of Real World Probabilities
What has it taught me ?
The combination of Matplotlib and Pandas empowers data analysts and scientists to unlock the full potential of their datasets. Matplotlib, a versatile and customizable plotting library, seamlessly integrates with Pandas, a powerful data manipulation and analysis tool. Together, they enable users to effortlessly generate insightful visualizations that bring data to life. With Matplotlib's rich plotting capabilities and Pandas' efficient data handling, complex datasets become accessible narratives. Whether it's crafting elegant line plots, insightful bar charts, or sophisticated heatmaps, this dynamic duo simplifies the process, making data exploration and communication a breeze. Matplotlib and Pandas foster a deeper understanding of data patterns, making it an indispensable toolkit for data-driven decision-making and storytelling.